November is right around the corner which can mean only one thing: election season. As both parties make their case for 1600 Pennsylvania Avenue, the rest of the nation waits in anticipation of what might unfold next. It’s hard to imagine a more polarizing election in our nation’s history than the one we are about to witness. There are rational concerns across the spectrum regarding many issues, but, it’s safe to say one topic that everyone is concerned with is the stock market and economy.
Is the economy better off with a Republican or Democratic President in control? Conventional wisdom says that liberal Democrats are generally ‘bad’ for the economy and stock market because of their big government tendencies, while conservative Republicans are good. Is this actually the case?
According to the research of Jeremy Siegel, a Professor of Finance at the Wharton School of the University of Pennsylvania, “stock markets do perform better under Democrats than under Republicans. That’s a well-known fact, but it does not imply cause and effect…” From 1952 through June 2020, annualized real stock market returns under Democrats have been 10.6% compared with 4.8% for Republicans.
As the 2020 election nears, some investors are becoming increasingly concerned about the pros and cons of a Trump vs. Biden presidency. Is this really warranted? Siegel doesn’t believe so, citing “Bull and bear markets come and go, and it’s more to do with business cycles than presidents.” So, you can take a sigh of relief.
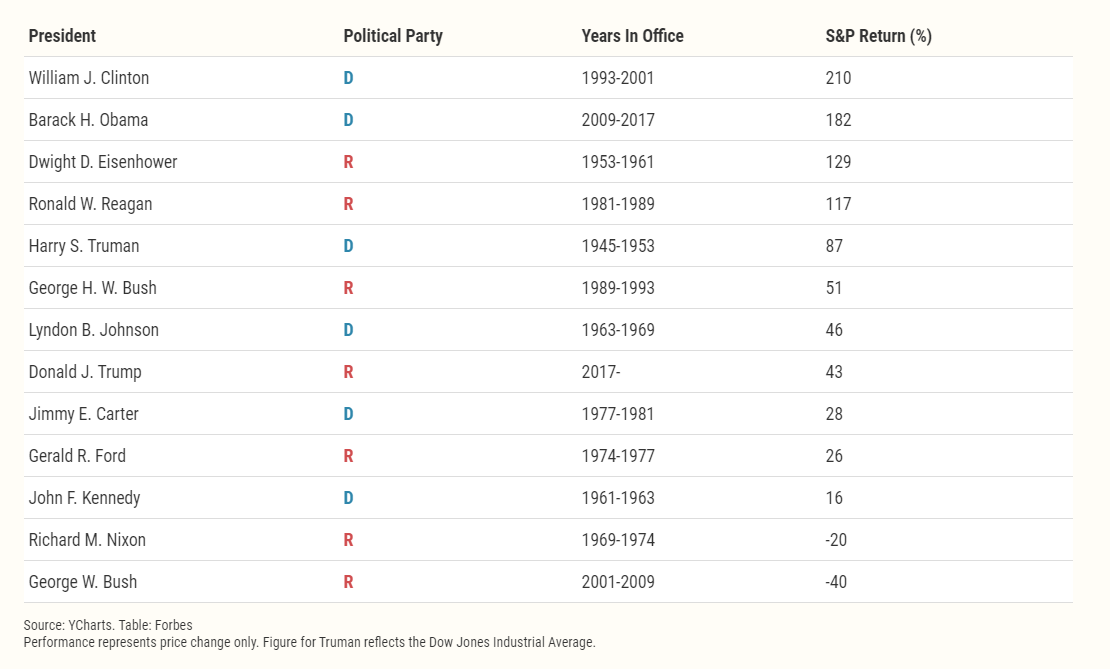
To take it a step further, Forbes conducted a study to examine the relationship between the actions of a president and the direction of stocks by analyzing their stock performances, including dividends, dating back to Harry Truman. See below.
Although past performance does not guarantee future results, history shows us that the stock market and economy have experienced great success with both Democratic and Republican Presidents. To see the full article and a more detailed explanation, click here!
If you’d like to speak to one of our advisors regarding your portfolio and how we can help, click here!