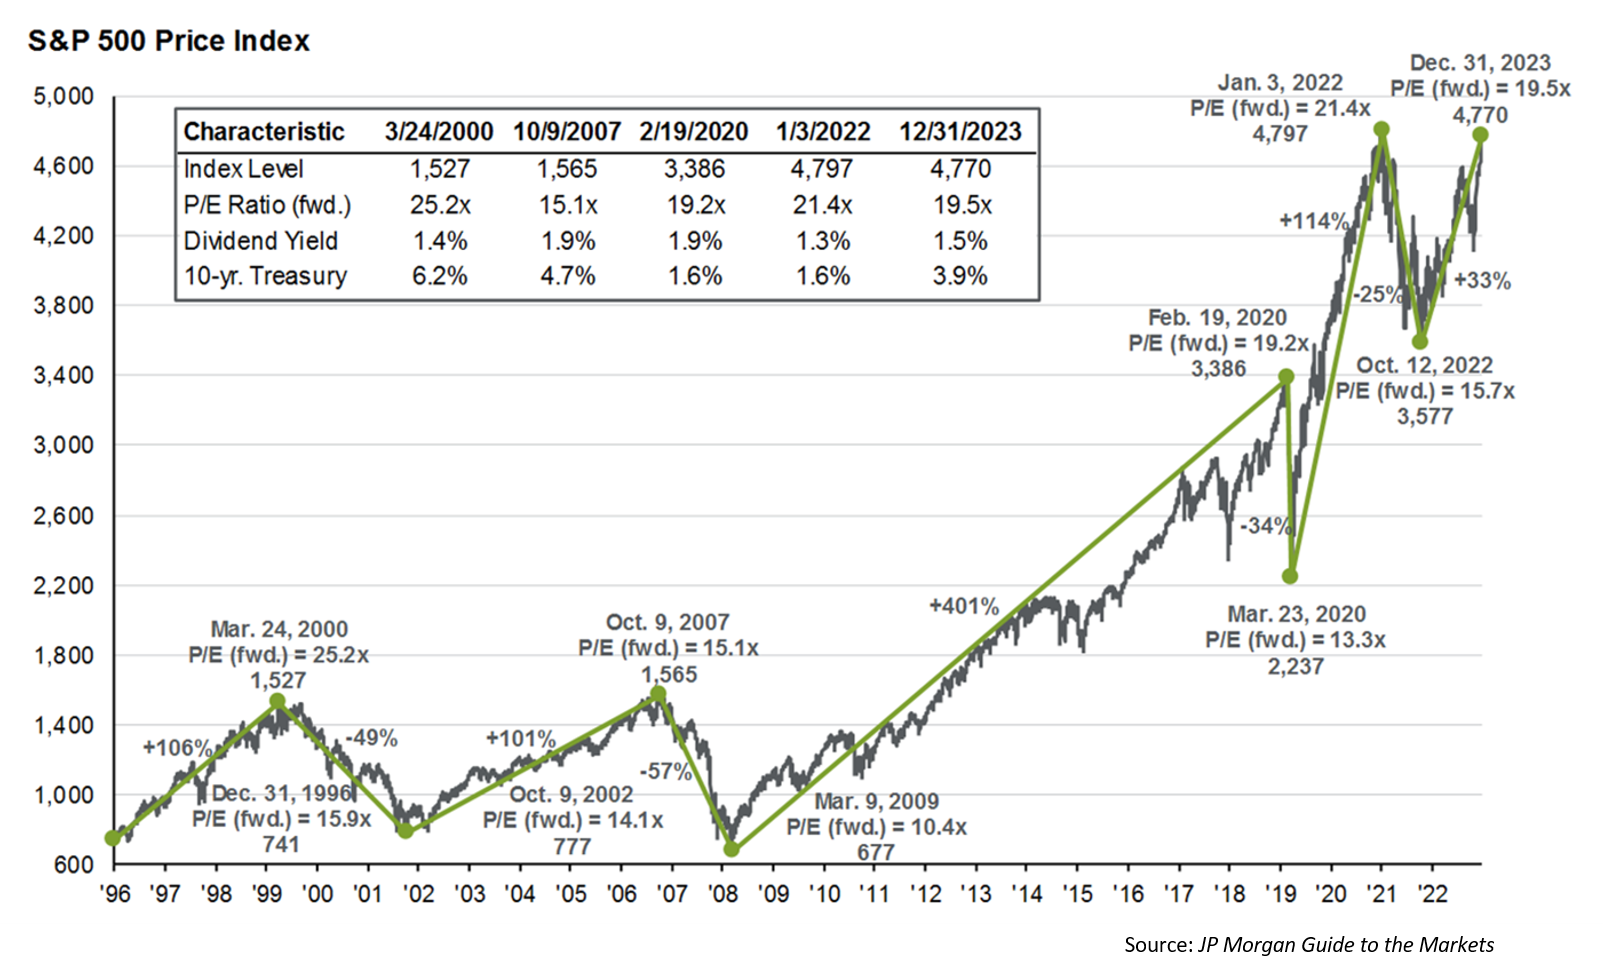
The S&P 500 has recently hit all-time highs once more after being down from the previous high in January of 2022. This is good news! But this may also generate questions in your mind- will it keep marching upwards? Are we now due for a downturn? Is this a time to get more aggressive or more conservative in my investment style? Do I need to do anything? These are all valid questions and require our attention.
Let’s consider why the S&P has surpassed its previous high watermark. The past two years, we have been recovering from the negative aspects from government fiscal response to the pandemic, namely inflation. Not only has inflation been an issue, but the labor market has been extremely competitive, with wages increasing quickly and labor being scarce, which in turn serves to fuel inflation. The Federal Reserve’s goal for the past two years has been to cool inflation back to their target of 2% while maintaining strong employment. Not an easy task in the least, because the most effective tools for reducing inflation have the tendency to cause higher unemployment. When the Fed increases the federal funds rate, which helps cool inflation, it makes borrowing costs increase, and thus slows economic growth.
The Fed’s goal of a soft landing, that is, cooling inflation without a recession, seems increasingly likely as we are seeing new data come in. We are seeing lower inflation figures year over year and our GDP is still growing at an acceptable clip, which has helped fuel positive forward expectations for the stock market. Stock prices are very much based on future expectations.
Now let’s consider where most of our stock market gains are coming from:
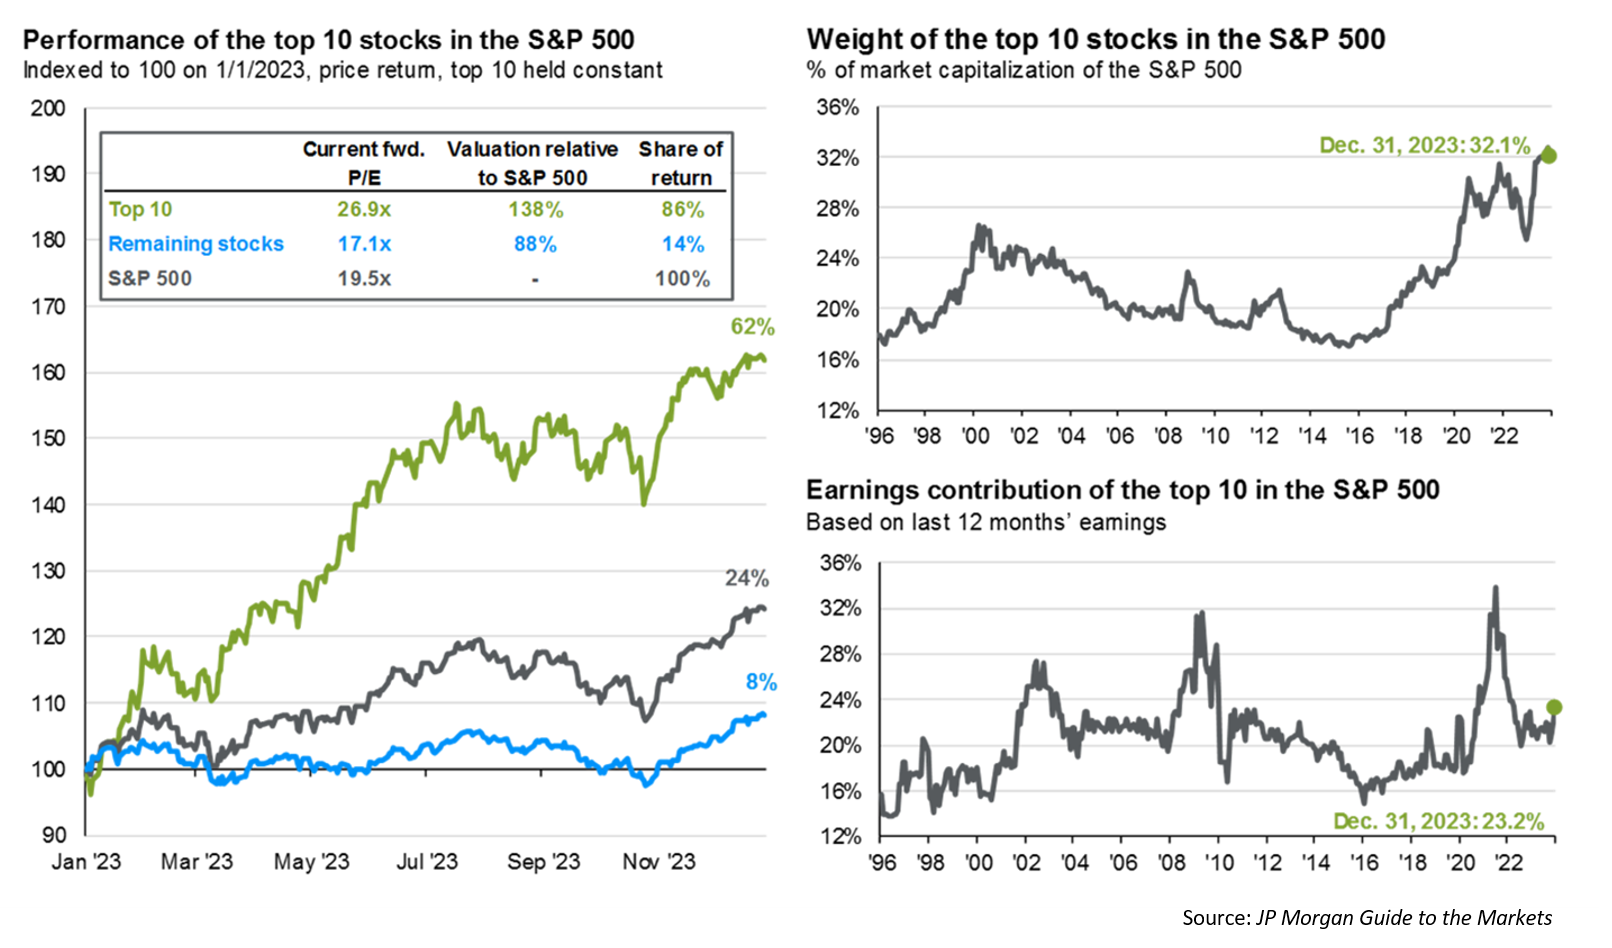
This illustrates how the top ten stocks of the S&P 500 have driven 86% of the returns, while the remaining 490 being responsible for only 14% of the returns. With the index being market capitalization weighted, meaning that the bigger the company, the higher the concentration in the index relative to the others, it shouldn’t be surprising that the top 10 stocks do drive a lot of the market’s returns. Winners tend to keep on winning and they have momentum. The top right graph shows that as of year-end 2023, the top ten stocks made up a whopping 32% of the value of the S&P 500.
Now knowing this, how does this impact you and your portfolio? We don’t know for sure how things will play out for the S&P 500 index in the near term, but we are confident in the long term that owning stocks is a good and necessary part of investing. We have spent a lot of time analyzing the S&P 500, but what about other sorts of stocks like small cap stocks, bonds, or international equities? Most guesses of how the market is going to perform in a given year end up being completely wrong. This is why we want to invest in diversified portfolios comprised of not just the S&P500, but also other types of securities that may be undervalued or less concentrated.
The illustration below shows asset classes and their returns each year from 2008 to 2023:
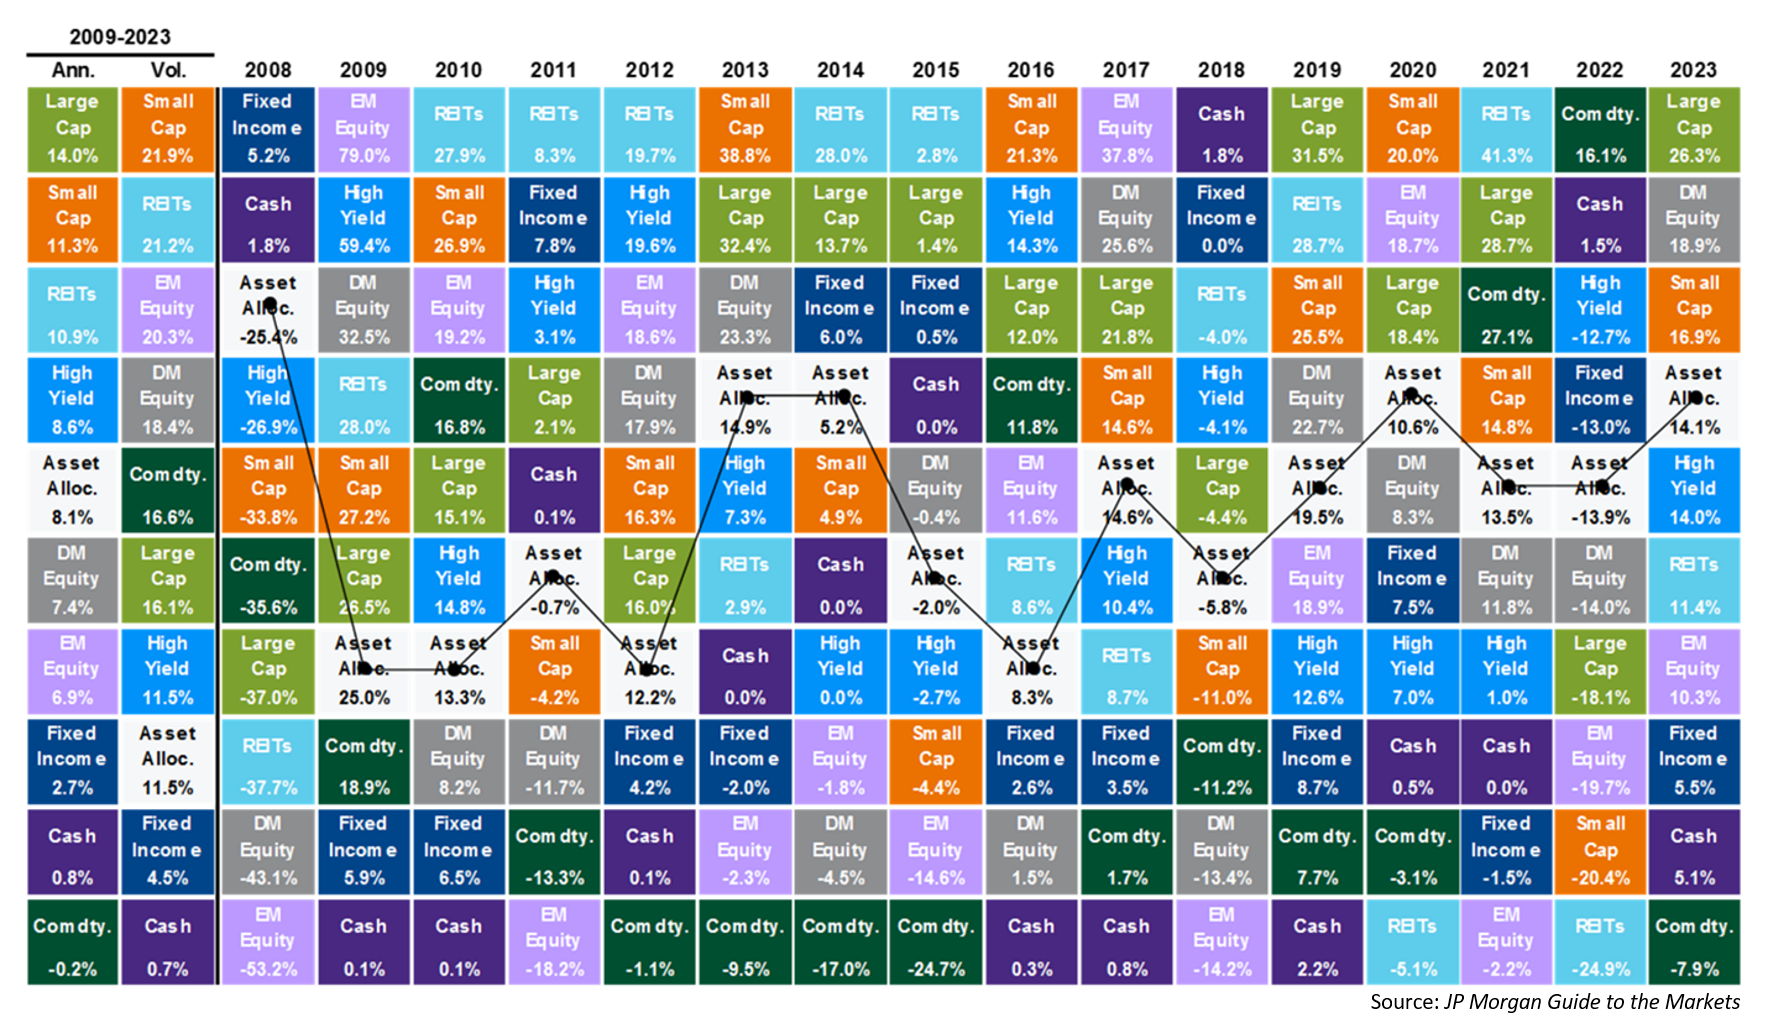
This illustrates exactly why we want to be invested in what’s labeled “Asset Allocation”. The S&P 500 is included in “Large Cap” on this illustration. What might surprise you is that there are only two years where “Large Cap” was the top dog. While “Asset Allocation” is not the highest returning investment style, it performs respectably with lower volatility- see the left side of the illustration showing average returns and volatility over this period.
At Sugarloaf, we strive to allocate your investments in such a way that best achieves your risk tolerance, ability to take risk, and investment goals. We want our clients to have portfolios that they are comfortable owning and not just rent, even when we reach new all-time highs in the market, because of the strategies we employ.